

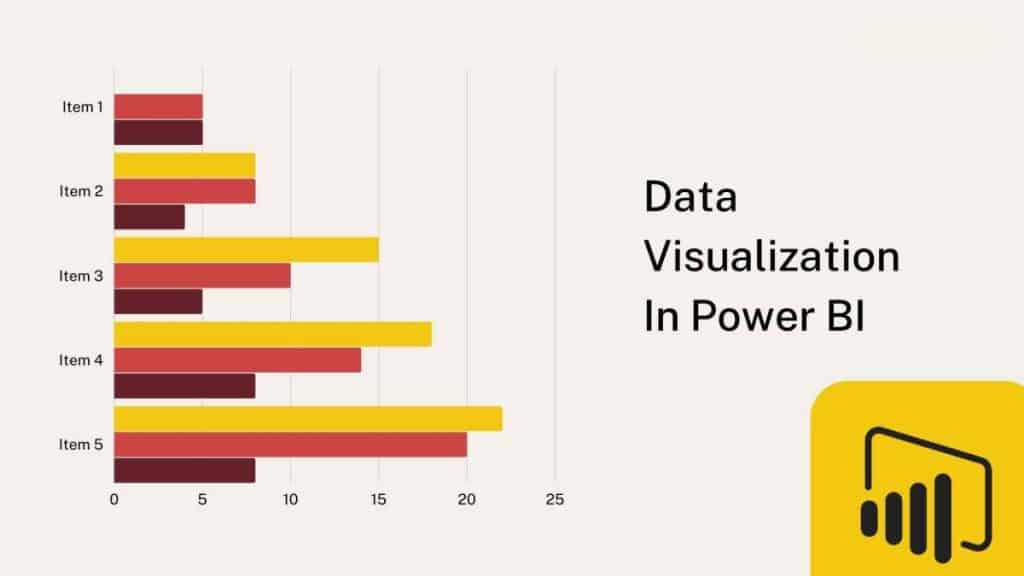
Today every business merely relies upon data visualization. It brings out hidden insights and helps drive the organization forward. Microsoft Power BI is the best option for a bright future for strategic decision-making.
Here is a question what is data visualization, and how does it aid in decision making. You need to know what you require and what can be your go-to solution.
What is data visualization?
When raw data transforms into a visual is called data visualization like points bar, graphs, and maps. It makes it super-easy for humans to pull out the insights and understand later on. Data visualization aims to check the patterns, spot the trends, and identify data sets.
Importance & Benefits of data visualization for strategic decision making:
Data visualization offers a quick and easy way to communicate with visual information. It enables the companies to look at the areas that require more attention, pinpoint the problem, and specify the customer behavior.
Now, fast-forward come to the following benefits:
- It can grip the given information and helps to make strategy-based decisions for the organization.
- It also helps in taking the next successful steps depending on your findings for business growth.
- Data visualization improves the ability to share insights with everyone involved in the team.
- The best benefit is that there is no need for the data scientist to access it.
- You make decisions backed by data, which make you confident and lead you toward better planning and actions.
- It also allows you to verify the broader context and reach a higher level of performance.
Evaluating data visualization:
Today, everything is available in the form of an application, whether complicated or easy to use. You will have to decide what to do before using Power BI data visualization to make strategic decisions. To fulfill your requirements, please read the details below:
- Features you require: The topmost are business intelligence, analytics, and report sharing. It will give the space and flexibility to meet your needs today and tomorrow.
- When and where to see the data? For better collaboration and delivery, you will require a tool that allows you to take your data anywhere and gives a quick insight.
Power BI training and Power BI courses to enforce data visualization:
Microsoft Power BI courses are the perfect solution to learn this software for personal and professional growth. Similarly, Power BI training plays a vital role in data visualization enforcement. It enables you to make business-friendly decisions. Another point is if you lead your team equipped with the latest Power BI training, you will simultaneously add credit to your company.
Enroll yourself first and be a pro-Power BI user:
Do you want to be a pro-Power BI user? Keep calm and stay focused. Enroll yourself in any well-reputed training firm. You will be halfway after doing so. Now, if there is one more question about where to get the training, the answer is Data Bear.
It is a Power BI training firm based in the UK with a fabulous team of motivated and trained lecturers. They provide you with efficient training and introduce all the new trends in Microsoft Power BI. Be there and catch your flying dreams after training.